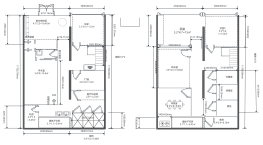
Top 10 positively- and negatively-correlated genes
GO-MFs
Disease Specific Survival (DFS)
2. Survival analysis
Nomogram plot
Tumor infiltrating immune cells
Subgroup survival analysis
Immunomodulator genes
KEGG pathways
Calibration plot
3. PPI and GGI network
GO-CCs
Progression Free Interval (PFI)
Top 200 correlated genes
5. Tumor immunity analysis
Overall Survival (OS)
Paired sample analysis
Kaplan Meier curves
GO-BPs
1. Expression pattern of TP73 gene in TCGA-pan-cancer and HNSC
Unpaired sample analysis
Univariate and multivariate cox regression analysis
Tumor microenvironmentEstimate-Immune-Stromal score
4. Functional and gene set enrichment analysis
Gene set enrichment analysis
Forest plot