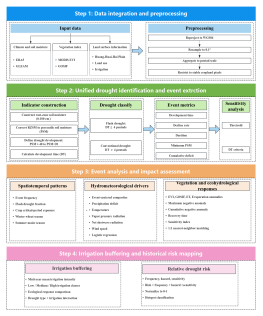
Indicator construction
Define drought development:PSM>40 to PSM<20
Resample to 0.1°
Restrict to stable cropland pixels
Irrigation buffering
Step 3: Event analysis and impact assessment
Hydrometeorological drivers
Construct root-zone soil moisture (0-100 cm)
Vegetation and ecohydrological responses
Reproject to WGS84
Event metrics
Step 2: Unified drought identification and event extrction
Input data
Convert RZSM to percentile soil moisture (PSM)
Muti-year mean irrigation intensityLow / Medium / High irrigation classesEcological response comparisonDrought type × irrigation interaction
Climate and soil moisture
Thretrold
Event frequencyFlash drought fractionCrop critical-period exposureWinter wheat seasonSummer maize season
Step 1: Data integration and preprocessing
Preprocessing
Vegetation index
Spatiotemporal patterns
Huang-Huai-Hai PlainLand useIrrigation
DT criteria
Flash drought:DT ≤ 4 pentads
Aggregate to pentad scale
ERA5GLEAM
MODIS EVIGOSIF
Relative drought risk
Durition
Decline rate
Sensitivity analysis
Conventional drought:DT > 4 pentads
Minimum PSM
Cumulative deficit
Drought classify
Development time
Calculate development time (DT)
Land surface information
Step 4: Irrigation buffering and historical risk mapping
Event-centered compositesPrecipitation deficitTemperatureVapor pressure radiationNet shotwave radiationWind speedLogistic regression