
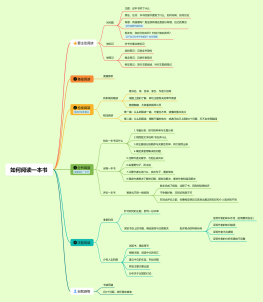
海绵城市
2018-09-14 19:20:14 0 举报仅支持查看
AI智能生成
海绵城市笔记
科研
模板推荐
作者其他创作
大纲/内容
论文经验
18/9
Stormwater runoff and export changes with development in a
<br>traditional and low impact subdivision
abstract
contian
stormwater runoff and pollutant concentrations in both a traditional development,<br> and a development that used low impact development techniques
Increases in total impervious area in each watershed
Regression relationships between total impervious area <br>and stormwater runoff/pollutant export
result
the use of low impact development techniques on a watershed scale can <br>greatly reduce the impacts of development on local waterways.
introduction
contain
the percentage impervious area is valid as a predictor of <br>stream impacts,and it is a simpler indicator to use
a definite relationship appears to exist between
<br>impervious area and multiple measures of stream health
there is a lack of peer-reviewed studies demonstrating the <br>effectiveness of the use of LID on a watershed scale
it is more difficult to establish causality when data from <br>different watersheds are analyzed at a discreet point in time
aim
compare stormwater runoff volume and pollutant export from adjacent traditional and LID subdivisions, <br>as development occurred, and as impervious surfaces were added in each of the watersheds.
method
Study area
location characteristics
in a drainage basin contributing to a small estuary
in a climate that is influenced by both continental <br>polar and maritime tropical air masses
Average annual precipitation is approximately 1237 mm <br>and is distributed uniformlythroughout the year
Hurricanes enter the state periodically
Soils are mesic typic Dystrudepts (the typical infiltration
<br>rate for this type of soil is 33 cm hr1)
the traditonal site
date
1997-2003
features
2.0 ha (17 lots)
a curb and gutter stormwater
<br>collection system
A typical 8.5-m asphalt road
result
Total impervious surface coverage<br> after constructionwas 32%
the LId site
date
1999-2002
features
1.7 ha (12 lots)
grassed swales.
a 6.1 m wide Ecostones paver road and
A bioretention cul-de-sac
Individual bioretention <br>areas (rain gardens)
driveways: alternatives to traditional asphalt
Deed restrictions
best management practices
result
total impervious area was 21%
Monitoring
objections
Stormwater volume (each year)
Flow-weighted samples
yaerly precipitation data
total impervious area present <br>on a weekly basis
Sample analysis
objections
TP
TN
Impervious area calculation
The percent impervious of the subdivision
total impervious area present <br>on a weekly basis
total watershed area<br> (may change due to constructions)
Data analysis
objections
Flow volume and pollutant export (each year)
Average total impervious area (%)(each year)
A log-normal relationship
Runoff coefficients
Regression significance testing
1
2
R2 calculations
parameter estimates
results amd discussions
the traditoanl site
stormwater runoff volume
TP
TN
the LID site
regression significance testing
TP
TN
Optimizing low impact development (LID) for stormwater runoff
<br>treatment in urban area
abstract
question
this requires many experimental and modeling efforts to test LID characteristics and <br>propose an adequate guideline for optimizing LID management.
contain
propose a novel methodology to optimize the sizes of different types of LID
method
by conducting intensive stormwater monitoring and numerical modeling in a commercial site
introduction
contain
1 <span class="fontstyle0">One of the greatest issues in pollutant emissions is the </span><span class="fontstyle2">fi</span><span class="fontstyle0">rst </span><span class="fontstyle2">fl</span><span class="fontstyle0">ush effect (FFE)</span>
<br style=" font-style: normal; font-variant: normal; font-weight: normal; letter-spacing: normal; line-height: normal; orphans: 2; text-align: -webkit-auto; text-indent: 0px; text-transform: none; white-space: normal; widows: 2; word-spacing: 0px; -webkit-text-size-adjust: auto; -webkit-text-stroke-width: 0px; ">
2 Mathematical modeling can be used to determine LID type <br>and placement with limited stormwater management funds
3 FFE provides an opportunity for Low Impact Development to be designed <br>more effectively by optimizing removal efficiency for the early part of runoff
aim
1 monitor/characterize stormwater runoffs from the study site
2 develop the stormwater model with observations
3 optimize the sizing of different LIDs for mitigating FFE
material and methods
Site description
0.0125 km2
The average annual rainfall 1391 mm
temperatures 29.3 C and -1.9 C
imperviousness approximately 85%
<b>stormwater</b> sampling and data acquisition
Stormwater runoff
suspended solids
Flow rates
samples for water quality analysis
Model description and <b>LID</b> modules
Model description
The EPA Storm Water Management Model
<b>quantity</b>
Manning's equation (surface runoff)
the GreeneAmpt mode(the amount of infiltration<br> of rainfall into the unsaturatedupper soil zone)l
<b>quality</b>
the build-up model
the maximum buildup possible
the half-saturation constant
the wash-off model
the wash-off coefficient
the wash-off exponent
LID modules
parameters
Bioretention cells
Infiltration trenches
Porous pavement
Rain barrels
Vegetative swale
Model calibration and sensitivity analysis
sensitivity analysis
theLatin Hypercube-One-factor-At-a-Time method
Model calibration
a pattern searching tool
the module performance
NasheSutcliffe Efficiency
The objective function
the sum of squared errors (SSE) by calculating the difference between<br>the observation and simulation for flow rate and suspended solids.
Optimizing LID size
<b>The representative rainfal</b>l for simulation of optimizing LIDsize
hourly rainfall data from 1981 to 2010
Inter-Event Time Definition
temporal rainfall distribution and<br> probability isopleths(Huff curves)
Huff curves of 50% probability
Objective of optimization: MFFn
mass first flush (MFF) ratio(MFF30<1)
results and discussion
Stormwater monitoring
Calibration, validation, and sensitivity analysis
the sensitivity analysis by LH-OAT<br> hydrological and water quality modules<br>
ranked the most sensitive
parameters
finds hydrologic and water quality parameters for calibration <br>using the pattern search tool in MATLAB software
models' performance by the Nash-Sutcliffe<br><br>model efficiency coefficients
Representative rainfall event
chose 17 h as the value of IETDand estimated 32.4 mm of <br>average rainfall and an average durationof 8.6 h
Changing LID size, the reduction of SS for rainfall patterns
SS loadings
the Event
Mean Concentrations (EMC)
reduction effect of each LID in terms of SS loadings, EMC, and FFcurves
Decision for optimal LID size considering MFF
MFF30 sharply decreased by
increasing LID size
ifMFF30 is equal to 1 for a given LID size,<br> we determined it as an optimal LID size.
this study simulated water quality dynamics using pollutant build-up and a wash-off module,<br> coupled with a hydrologic response. (considering FFE rather than whole treatment performance)
conclusion
In this study, LID was designed by applying a modeling approach
<br>with stormwater monitoring in an attempt to improve water
<br>quality rather than flooding reduction.
produced a representative rainfall event for the given site,<br>considering IETD, the observed rainfall pattern, and Huff curves.<br>the value of the Inter-Event Time Definition (IETD)
The SWMM simulation demonstrated that EMC is <br>highly variable in response to different sizes of LID, <br>implying that there is a need to optimize the LID size.
The optimal LID sizes were proposed based on mass first flush
<br>(MFF) which is an indicator to quantify FFE, ranging from
<br>1.2 mm to 3.0 mm in terms of runoff depths.
Effectiveness of low impact development practices in two urbanized watersheds:
<br>Retrofitting with rain barrel/cistern and porous pavement
abstract
contain
This study assessed the performance of rain barrel/
<br>cistern and porous pavement as retrofitting technologies in two urbanized watersheds
method
Six scenarios consisting of the watershed existing condition, <br>25% and 50% implementation of rain barrel/cistern and porous pavement, <br>and 25% rain barrel/cistern combined with 25% porous pavement
a proposed LID modeling framework
the Long-Term Hydrologic Impact Assessment (L-THIA)eLID model.
results
the application of 50% rain barrel/cistern, 50% porous
pavement <br>and 25% rain barrel/cistern combined with 25% porous pavement <br>are good retrofitting
options in these watersheds.
introduction
introduction of barrels or cisterns
introduction of Pocrous pavements
there is currently little quantitative information
describing <br>potential impacts of these practices at the watershed
scale
without much consideration given to
baseflow
the objective was to document the effectiveness of LID practices <br>in managing urban water at the watershed scale
simulating watershed level impacts of rain water<br> harvesting systems (specifically, rain barrel, cistern)
porous pavement onrunoff, <br>baseflow, and total streamflow.
L-THIAeLID model description
allows the user to evaluate the effects of <br>LID strategies on water quantity and qualty
the CurveNumber (CN) method<br>(the relationship between watershed storage and initial abstraction,)<br>
The relationship between the CN and the watershed storage. S
The model estimates direct<b> runoff (Q, mm)</b> <br>for a given precipitation depth
Event Mean Concentration (EMC) values<br>(from USEPA)
pollutant loads 1
an empirical equation,to estimate <b>the baseflow </b><br>component of the total streamflow (for the study<br>region with watershed characteristics)
Baseflow Pollutant Coefficients (BPCs) <br>(from USEPA)<br>
pollutant loads 2
BFI is the baseflow index. BFI is related to CN <br>(was developed with data having a CN range of 70-90)
materials and methods
study areas
location
the Little Eagle Creek watershed (LEC)
the Little Buck Creek watershed (LBC)
reasons
highly urbanized
have streamflow gauge <br>stations at their outlets
studies previously conducted in the LEC watershed<br> to use as benchmarks for the present study.
Input data preparation
<b>precipitation data</b><br>(The National Climatic Data Center ) <br>weather station 124272 (1991-2010))
<b> Measured daily streamflow</b><br>(the USGS streamflow observation stations<br> 03353600 and 03353637 (1991-210))
<b>Hydrologic soil group (HSG) information </b><br>( the Soil Survey Geographic (SSURGO) database of<br>the United States Department of Agriculture and <br>Natural Resources Conservation using <b>ArcGIS</b>
<b>6 categories of land uses</b><br>(National Land Cover Dataset (NLCD)<br> with 10 m resolution using<b> ArcGIS)</b>
<b> EMC and BPC values (TN and TP) <br></b>(the Indiana Department of Environmental Management <br>and Ahiablame (2012) respectively)<b><br></b>
Modeling approach overview
a computational framework
recommended/published CN values
design guidelines
estimate runoff with distributed CN approach
baseflow was calculated for the entire study
<br>watershed using Equation (5)
the LID practice effectiveness<br>index (EILID)
Model calibration and validation
increasing or decreasing all CN values with a 1% increment at a time (a whole number) using<br><br>R2 and NasheSutcliffe efficiency coefficient (NSE) as model performance measures.
the adjustment of pre-storm soil moisture<br> (antecedent moisture condition) was not made
Baseflow was not calibrated but was <br>validated for the study watersheds
Simulation of low impact development practices
Six land use and<br>planning scenarios (1-6)
the CN values are from literature
results and discussions
results
Calibration and validation of L-THIAeLID
<b>annual runoff</b> predictions are <br>satisfactory for the two watersheds.
In the LEC watershed,did not improve <b>baseflow</b> estimates:<br>in the LBC watershed, they are good at <b>baseflow</b> generation processes
the estimations of total <b>streamflow</b> in the LBC watershed <br>are better than that in the LEC watershed
Performance of LID practices
runoff
Simulated runoff was slightly
less than the <br>observed runoff, on average, in the LEC
no significant difference between simulated and
<br>observed runoff in the LBC watershed
baseflow
For both watersheds,
simulated baseflow<br> is higher than observed baseflow.
streamflow
pollutant
The simulated pollutant loads in this study are consistent with
<br>previous modeling studies conducted in the LEC watershed
discussions
runoff
reduction levels achieved appear small but should not be ignored
baseflow
suggest that LID practices have the potential to restore water balance
streamflow
prove the effectiveness of LID practices
conclussion
take cost into consideration
18/10/1
EPA手册
自由主题
国家经验
20C90th美国
《绿色基础设施手册》
各州低影响开发设计手册
清净水法案
2014中国
《关于推进海绵城市建设指导意见》
《海绵城市建设技术指南》
<h3><b style="color: inherit; font-family: inherit; font-size: 17px;">对城市原有生态系统的保护</b></h3>
生态恢复和修复
低影响开发
雨水管理系统
理念
径流总量
渗透、储存
峰值流量
渗透、储存、调节
峰现时间
调节
途径
场地源头
消纳径流增量(渗透)
透水铺装
渗透塘
渗井
渗管/渗渠
人工土壤渗滤
中途
传输(调节)
绿色屋顶
下沉式绿地
调节池/塘
初期雨水弃流设施
末端
调蓄净化
生物滞留带
湿塘
雨水湿地
蓄水池
雨水罐
植草沟
植被缓冲带
控制指标
径流总量控制
年径流总量控制率
概念
目标
与设计降雨量之间的关系
依据
未有计算方法
我国大陆地区年景路总量控制率分区图
径流峰值控制
径流污染控制
雨水资源化利用
技术路线
确定城市水文环境、地貌特征、需求
确定城市总体控制指标
根据各地区差异划分地块,并计算控制指标
指南试算法
模型模拟计算
调整各地块控制指标,根据面积加权平均使其满足城市总体控制指标
具体实施
建筑
屋顶组织径流
低层组织汇流储存
小区
小区道路
组织汇流与转输
与雨水管渠和超标雨水径流排放系统相衔接
小区绿地
消纳、渗透、储存雨水
城市道路
绿地与广场
周边水系
雨水管渠系统
超标雨水径流排放系统
澳大利亚
荷兰
英国
子主题
子主题
透水路面设计内容
选择合适的透水路面结构系统
依据
路基下面原土壤层的渗透能力
是否存在易受水和荷载影响的原土层,例如可溶性岩石
存在污染地下水的风险
路基下原土壤层内是否有污染物存在
渗水路面结构
全渗透
部分渗透
不渗透
路面结构各层材料的选择
路面材料
填缝材料、垫层材料
上层土工布
基础材料层
孔隙率
颗粒级配
颗粒形状稳定性
骨料物理特性
防水膜
抗变形性能
抗腐蚀性能
搭接连接处密封性好
确定整个路面结构中储水能力
储水材料层的储水能力
暴雨重现期降雨量设计值
汇水面积
路面坡度和尺寸
确定路面结构中各层材料的厚度
设计参数
原土壤层(指经施工处理后)的CBR 值
路面上交通量设计值
道路在施工期间的荷载交通量
各层材料
砂垫层
胶凝粘接粗骨料层
(DBM层)
粗骨料层
底基础材料层
结构基础层
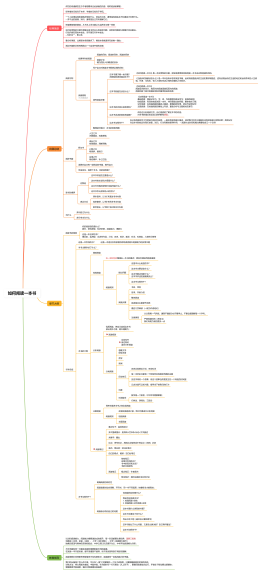
SWMM
原理
大气模块
来自大气的降水和污染物,为探究区域的子流域提供降水数据
<b>雨量计</b>
地表模块
接受来自大气模块的降水
以下渗出流的形式像地下水模块运输物质
<b>覆盖研究区域的子流域组成</b>
一个子流域只有一个水流出口,根据需要将研究区域进行划分
子流域被划分为
透水区域
霍顿模型
格林安普特模型
径流曲线法
不透水区域
具有蓄水功能
不具备蓄水功能
将地表径流和污染物负荷运送至运移模块
地下水模块
接受来自地表模块的下渗量
将此下渗量运送到运移模块
含水土层(蓄水层)
运移模块
运送来自地表径流、地下水交换、晴天污水排放
运移
节点
交叉点
自然河道的汇合点
下水道的人工口
管件链接配件
排水口
排水系统的终端节点
动力波径流方程演算的下游边界
分流器
将入流水量按照一定的调度规则将水流分流到指定管道
可以同时将两个及以上的管道连接在一起,并在分流端进行分流
仅适用于完整动力波计算径流的情况
切断
溢流
石板
塘堰
储水单位
水池、湖泊
接受来自其他节点的入流和泄水
通过表面蒸发和下渗过程失水
连接
管道或导管
管道、渠,从一个节点运到另一个节点
水泵
将水送往海拔更高的地方
水泵曲线描述水泵入口和出口节点处的径流速率和状态关系
不在一条线上的水泵和水井
径流随着水井的容量增加而增加
在一条线上的水泵径流
径流随着入口节点的深度增加而增加
径流随着入口与出口水头不同而持续变化
出水速率随着入口节点深度的变化而变化
抽水速率等于径流在入口节点的速率
调节器
控制和使水流转向的结构或驱动器
释放储水设备的存储空间
阻止多余水量
孔口
排水系统中的出口和转向结构装置
作为出口的储水单元
用来分析动力波径流路径
堰
排水系统中的出口和转向结构装置
横向堰
溢流堰
V型凹槽堰
梯形堰
作为出口的储水单元
用来分析动力波径流路径
出口设施
用来分析动力波径流路径
作为出口的储水单元
用来分析动力波径流路径
使水流向污水处理厂和拦截设施流动
模拟传输性质的单元(渠系、管道、水泵、阀门)和储存或处理性质的单元(污水处理厂、传送器)
不可见模块
气象数据
温度
融雪
蒸发
子流域地表的水面
地下水含水层表层
储水单元中的蓄水
风速
融雪
融雪
区域损耗
子流域各地表融雪加速趋势不一致造成的
区域损耗曲线
透水区域
不透水区域
水文数据
含水层
模拟地表以下水分垂直下渗的运动过程
根据水力坡度
地下水渗入排水管道
排水管道渗漏到地表水
融雪
单位流量过程线UHS
根据降水量估算流入或下渗到下水道系统中的水量。
短历时响应曲线
长历时响应曲线
R:降水进入下水道系统的部分径流
T:降水开始时间到单位流量曲线到达峰值的时间
K:单位流量曲线到达峰值后退水时间速率
中等历时响应曲线
LID调控
作为子流域的固有属性
生物减缓因子使径流减少
细缝渗漏
不透水区域上存在的被沙砾石所填充的细小空间,截留部分径流
连续多孔渗水人行道系统
水桶或水塔在降雨时收集屋顶的雨水
LID的显示
调控示意图可以由一组连接在一起的垂向图层表示
LID的利用
创建一套可以在研究区域被全局编辑的带尺度的调控器
给选定的子流域设定可任意混合的和任意大小的调控器
LID的配置
LID的结果
由SWMM对总径流、下渗和蒸发速率的模拟结果反映出来
植被生长良好的沼泽洼地
截留水量可转移到啥事层中地下水系统中,而不全部下渗
细缝渗透和多孔人行道系统的水力传导梯度随时间的推移由于多孔被堵塞而变小
水力数据
横断面
入流
直接入流
用户自定义的入流节点的时变入流
晴天入流
排水管道系统中的公共污水排放或小管道和河渠中的基流
降水-入流和下渗RDII
暴雨径流
控制器
调控准则
决定水泵和调整期在传输系统中的运行方式
水质数据
污染物
模拟用户自定义的任意数量的污染物的产生、流动和运移过程
土地利用
根据土地利用的分类
住宅区
商业区
屋顶
草坪
人行道
未受干扰土壤
工业区
为开发区
冲刷和累计函数
污水处理
给节点赋予一组处理函数
数据列表
模拟计算方法
地表产流径流
子流域被处理成非线性蓄水池
流入项
降水
来自上游子流域的水流
流出项
入渗
蒸发
地表产流
蓄水池
积水
使地表湿润量
被截留水量
下渗
下渗方式
霍顿方程
根据经验
最大最小下渗速率
速度随时间变化的衰减系数
土层从完全饱和到完全干燥的时间
格林安普特方程
假定存在湿润峰
初期土壤含水量
水力传导度
湿润峰水头高
径流曲线数值方法
假定土壤的总下渗能力可以从土壤(含水层)曲线获取
曲线的数据序列
土壤从饱和湿润到完全干燥所需时间
地下水
下部饱和区域
对于一定孔隙率phi的土层来说,含水量是一定的
上部非饱和区域
其含水量theta经常发生变化
融雪
流量计算
利用质量和动量守恒方程计算导管中的稳定流和非稳定流(如圣维南方程)
稳定流法
假定每个计算时段流动都是均匀恒定的
运动波法
运用连续动量守恒方程计算导管水流情况
动力波法
通过求解完整的圣维南方程组进行汇流演算,最为精确
地表积水
水质模拟
主菜单
工程操作
子主题

收藏
立即使用
职业:暂无

Collect
Get Started
Collect
Get Started
Collect
Get Started

Collect
Get Started
评论
0 条评论
下一页

