
机器学习总结基础-1
2024-06-20 16:31:17 0 举报AI智能生成
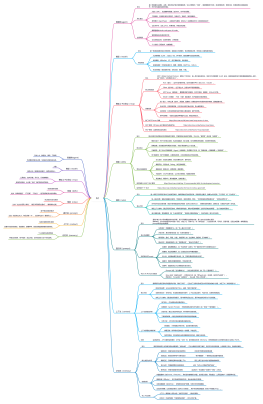
机器学习总结基础-1是一份详细的概述,涵盖了机器学习的核心概念、算法和应用。这份资料以易于理解的语言阐述了各种基础算法,如线性回归、逻辑回归、决策树、支持向量机等,并介绍了它们在实际问题中的实现。此外,文档还包括了数据预处理、特征工程、模型评估等关键步骤,以及如何利用Python等编程语言进行机器学习实践。无论是对初学者还是有一定基础的学习者,这份资料都是理解和掌握机器学习的宝贵资源。
机器学习
AI
人工智能
人工智能算法
机器学习算法
模板推荐
作者其他创作
大纲/内容
numpy
numpy.genfromtxt
genfromtxt("world_alcohol.txt", delimiter=",", dtype=str)<br>
创建
arr = np.random.random((4, 6))
arr.shape[0]
arr.shape[1]
arr.ndim
arr.size
arr.reshape(3, 8)
arr.reshape(-1)
score = np.random.randint(80, 100, 30)
score[score >= 95]
score[score <= 85]
arr2 = np.random.randint(0, 10, (4, 4))<br>arr3 = np.random.randint(0, 10, (4, 4))
arr4 = np.zeros((16, 16))
arr4[0] = 1<br>arr4[15] = 1<br>arr4[:, 0] = 1<br>arr4[:, 15] = 1
arr4 = np.ones((2, 3, 4), dtype = np.int32)
3维矩阵,2条 3行,4列
arr5 = np.random.randint(0, 100, 10000)
arr.view()
指向位置不同,数据相同
arr.copy()
指向位置不同,数据不同
np.tile(a, (3, 5))
对a进行扩展, 行扩充3倍, 列扩充5倍
np.sort(a, axis = 1)
按列进行排序
i = np.argsort(a)
对索引进行排序,按照从小到大排序
a[i]
排序后的数据
选择
ver = np.array([5 ,6, 7, 8])
import numpy as np<br>x = np.array([[1,2,3],[4,5,6]])
world[1, 4]
索引从0开始,第二行,第5列
world[2, 2]
第3行,第3列
world[0 : 3]
第1行,前3列的值
world[:, 1]
所有行,第2列
world[:, 0:2]
所有行,前2列
world[1:3, 0:2]
第2行和第3行,前2列
计算
min
max
sum(axis = 0)
行相加, axis =1 列相加
A = np.array([[1,1],[0,1]])<br>B = np.array([[2,0],[3,4]])<br><br># 位置相乘<br>print (A * B)<br><br># 矩阵乘法<br>print(A.dot(B))<br>print(np.dot(A, B))<br>
np.exp(B)
e 的 B次幂
np.sqrt(B)
B次方跟
np.floor
向下取整
a.rabel()
矩阵转换为向量
特征归一化
mu = np.average(X, axis = 0)<br>
求均值
dihms = np.std(X, axis = 0, ddof = 1)
求方差
X = (X - mu) / sigma
转换
np.arange(15)
创建15个数据
reshape(3, 5)
转换成矩阵
reshape(3, -1)
# 间隔固定数据累加创建数据<br>x = np.arange(10,30,2)
# 相同间隔创建数据<br>x = np.linspace(0, 20, 100)
astype(float)
类型转换
拼接
np.hstack([arr2, arr3])
np.vstack([arr2, arr3])
分割
np.hsplit(a, 3)
按行,切分成3份
np.hsplit(a, (3, 4))
按行,第4行,第5列切分
np.vsplit(a, 3)
按列,切分成3份
ndarray
# 最小二乘法,求解方程<br># 定义误差函数<br># param: 需要求解的直线系数【a, b】, 直线方程为 y = ax + b<br># x: 观测数据x<br># y: 观测数据y<br>import numpy as np<br>from scipy import optimize<br><br>def error_fun(param, x, y):<br> expect_y = param[0] * x + param[1]<br> err = y - expect_y<br> return err<br><br><br>x = np.array([1,2,3,4])<br>y = np.array([6,5,7,10])<br># 初始化系数<br>init_param = np.array([0.1, 0.1])<br><br># 求解<br>res, k = optimize.leastsq(error_fun, init_param, args=(x, y))<br>print(res[0], res[1], k)
pandas
Series
s1 = pd.Series({'a':11, 'b':22, 'c':33})
s2 = pd.Series([11, 22, 33], index = ['a', 'b', 'c'])
DataFrame
子主题
加载
pd.read_excel
pd.read_csv
摘要
dt.head()
显式前5条数据
dt.head(10)
dt.tail()
显式后5条数据
dt.tail(10)
dt.columns
dt.shape
筛选
过滤数据<br>
显式前3行
df[1:3]
显示特定的行、列<br>
df.loc[1:3, ['star']]
显式指定列
df[["star","new_star"]]
df['star'] == '力荐'
df [ df['star'] == '力荐' ]
loc
df.loc[0]
显式第1行,第1个数据
df.loc[3:6]
第一行,3-6列数据
df.loc[83, "Age"]
查看83行, Age列的数据
按列获取
df['ID']
获取列名为ID的列
df["ID", "NAME"]
a_is_null = pd.isnull(a,type=int32)
显式空数据
len(a)
显式个数
df.apply(func)
数据执行func函数
iloc
处理
df.fillna(axis = 1)
df.fillna(axis = 0, subset=["age", "name"])<br>
df.dropna()<br>
排序
df.sort_values("Age", ascending = False)<br>
按Age 升序排序
df.reset_index(drop = True)<br>
重置索引
pd.to_datetime(a)
时间转换
计算
df['EK'].max()
min()
mean()
df.sort_values("X", inplace = True)
np.add(a, b)
np.sin(a)
显式
增加列名
df.columns = ['star', 'vote', 'shorts']
删除
删除空数据
df.dropna()
数据聚合<br>
df.groupby('star').sum()
创建新列
df['new_star'] = df['star'].map(star_to_number)
分组
自定义区间离散化(分箱、分组)
# 对Amount 进行自定义离散--分箱分组<br>cut_points = [0, 13, 14, 15, 16]<br>RFM['radius_mean_bin'] = pd.cut(RFM['radius_mean'], bins = cut_points)<br>RFM.head()
等宽离散化
RFM['radius_mean_width_bin'] = pd.cut(RFM.radius_mean, 20)<br>RFM.head()
等深离散化
RFM['radius_mean_depth_bin'] = pd.qcut(RFM.radius_mean, 5)<br>RFM.head()
画图
散点图
data.plot.scatter(x = var, y= 'SalePrice', ylim = (0, 800000))
plt.scatter(y_test, y_test_preds) # 预测与实际值散点图<br>plt.plot([0, max(y_test)], [0, max(y_test_preds)], lw = 1, linestyle='--')<br>plt.xlabel('实际值')<br>plt.ylabel('预测值')<br>plt.show()
柱状图
# age分布<br>train_src.hist(column='Age', bins = 50)
# 性别分布<br>train_src["Sex"].value_counts().plot(kind = "bar")
# 性别与目标生存的相关性<br>pd.crosstab(train_src.Sex, train_src.Survived).plot(kind = "bar")
# Age 与目标生存的相关性<br>train_src.age = pd.cut(train_src.Age, [0, 5, 15, 20, 25, 35, 50, 60, 100])<br>pd.crosstab(train_src.age, train_src["Survived"]).plot(kind = "bar")
填充
classes = ["03020" + str(i) for i in range(1, 10)] + ["0302" + str(i) for i in range(10,31)]<br>objectes = ["语文","数学","英语","物理","化学","计算机"]<br>df = pd.DataFrame(np.random.randint(70, 100, (30, 6)), classes, objectes)<br>
gender = ['男' if np.random.random() < 0.5 else '女' for i in range(30)]<br>df2 = pd.DataFrame(gender, index = classes, columns = ['性别'])<br>
合并
c = pd.concat([df_cp, df2], axis = 1)
matplotlib
基本设置
import matplotlib.pyplot as plt<br>
plt.plot(df['a'], df['b'])
x轴, y轴数据
plt.show()
展现图表
plt.xticks(rotation=45)
指定x轴数据显式角度
plt.xlabel('xxxx')
plt.xlabel('yyyy')
plt.title("标题")
子图
fig = plt.figure(figsize=(3, 6))
指定画图区间, figsize = (长, 宽)
ax1= fig.add_subplot(2, 2, 1)
2行, 2列,第一个图
ax2=fig.add_subplot(2, 2, 2)
2行, 2列,第二个图
ax4=fig.add_subplot(2, 2, 4)
2行, 2列,第四个图
ax.plot(df)
显式摘要
plt.legend(loc = 'best')
label = xxxx
plt.legend(loc = 'upper left')
柱状图
fig, ax = plt.subplots()<br>ax.bar(x, y, 0.3)<br>plt.show()
默认纵向
ax.barh(x, y, 0.5)
横向
fig, ax = plt.subplots()<br>ax.hist(x, y, range=(4, 5), bins = 20)<br>plt.show()
range 指定区间, bins 20个柱
ax.set_xlim(0, 50)
指定区间
ax.set_ylim(0, 50)
散点图
fig, ax = plt.subplots()<br>ax.scatter(x, y, 0.5)<br>plt.show()
箱线图
fig, ax = plt.subplots()<br>ax.boxplot(x)<br>plt.show()
# 绘制前三个特征的直方图<br>first_three_features = features[:3]<br>fig, axes = plt.subplots(nrows = 3, ncols = 1, figsize = (8, 10))<br><br>for i, feature in enumerate(first_three_features):<br> axes[i].hist(X[feature], bins = 30, color='skyblue', edgecolor='black')<br> axes[i].set_title(f"{feature} - 直方图")<br> axes[i].set_xlabel('值')<br> axes[i].set_ylabel('频数')<br> axes[i].grid(True, axis = 'y', linestyle='--', linewidth = 0.7, alpha = 0.6)<br><br>plt.tight_layout()<br>plt.show()
直方图
df_user['R值_x'].plot(kind = 'hist', bins = 20, title = '新进度分布直方图')
plt.hist(user_id_itemcnt.values)
散点图
import seaborn as sns<br>plt.scatter(df.index, df['A'])<br>plt.show()
折线图
import matplotlib.pyplot as plt<br>plt.plot(df.index, df['A'], )<br>plt.show()
plt.plot(df.index, df['A'], <br> color='#FFAA00', # 颜色<br> linestyle='--', # 线条样式<br> linewidth=3, # 线条宽度<br> marker='D') # 点标记
密度图
# 画密度图<br>def density_plot(data):<br> plt.rcParams['axes.unicode_minus'] = False # 显式正负号<br> p = data.plot(kind = 'kde', linewidth = 2, subplots = True, sharex = False, figsize = (10, 9))<br> [p[i].set_ylabel(data3.columns[i], fontproperties = 'SimHei') for i in range(k)]<br> plt.legend()<br> return plt<br><br>for i in range(k):<br> density_plot(data3)
手肘图
from sklearn.cluster import KMeans #导入KMeans模块<br>def show_elbow(df, ax, title):<br> distance_list = []<br> K = range(1, 9)<br> for k in K:<br> kmeans = KMeans(n_clusters = k, max_iter = 100)<br> kmeans = kmeans.fit(df)<br> distance_list.append(kmeans.inertia_)<br> ax.plot(K, distance_list, 'bx-')<br> ax.set_xlabel('k')<br> ax.set_ylabel('距离均方误差')<br> ax.set_title(title)<br><br>fig, axes = plt.subplots(1, 3, figsize = (18, 6))<br><br>show_elbow(df_user[['R值_x']], axes[0], 'R值聚类K值手肘图')<br>show_elbow(df_user[['F值_x']], axes[1], 'F值聚类K值手肘图')<br>show_elbow(df_user[['M值_x']], axes[2], 'M值聚类K值手肘图')<br><br>plt.tight_layout()<br>plt.show()
绘制分类矩阵
# 误分类矩阵<br>cnf_matrix = metrics.confusion_matrix(train_y, train_y_pred)<br># 绘画分类矩阵<br>def show_confusion_matrix(cnf_matrix, class_labels):<br> plt.matshow(cnf_matrix, cmap=plt.cm.YlGn, alpha = 0.7)<br> ax = plt.gca()<br> ax.set_xlabel('Predicted Label', fontsize = 16)<br> ax.set_xticks(range(0, len(class_labels)))<br> ax.set_xticklabels(class_labels, rotation=45)<br> ax.set_ylabel('Actual Label', fontsize=16, rotation = 90)<br> ax.set_yticks(range(0, len(class_labels)))<br> ax.set_yticklabels(class_labels)<br> ax.xaxis.set_label_position('top')<br> ax.xaxis.tick_top()<br><br> for row in range(len(cnf_matrix)):<br> for col in range(len(cnf_matrix[row])):<br> ax.text(col, row, cnf_matrix[row][col], va = 'center', ha = 'center', fontsize = 16)<br><br>class_labels = [0, 1]<br>show_confusion_matrix(cnf_matrix, class_labels)<br>
绘制验证曲线(validation curve)
param_range = [0.0001, 0.001, 0.01, 0.1, 1.0, 10.0, 100.0, 1000.0, 10000.0]<br>train_scores, test_scores = validation_curve(<br> estimator = lr, # 指定模型<br> X = train_X,<br> y = train_y,<br> param_name = 'C',<br> param_range= param_range, <br> cv = 10)<br><br># 计算训练集合测试集准确率的均值和标准差<br>train_mean = np.mean(train_scores, axis = 1)<br>train_std = np.std(train_scores, axis = 1)<br><br>test_mean = np.mean(test_scores, axis = 1)<br>test_std = np.std(test_scores, axis = 1)<br><br><br># 对训练集的准确率作图<br>plt.plot(param_range, train_mean, color = 'blue', marker='o', markersize = 5, label = 'training accuracy')<br># 对训练集准确率的可信范围(上下限)作图: 上限: train_mean + train_std 下限:train_mean - train_std<br>plt.fill_between(param_range, train_mean + train_std, train_mean - train_std, alpha = 0.15, color = 'blue')<br><br># 对测试集的准确率作图<br>plt.plot(param_range, test_mean, color = 'blue', marker='o', markersize = 5, label = 'test accuracy')<br># 对测试集准确率的可信范围(上下限)作图: 上限: test_mean + test_std 下限:test_mean - test_std<br>plt.fill_between(param_range, test_mean + test_std, test_mean - test_std, alpha = 0.15, color = 'green')<br><br>plt.grid()<br>plt.xscale('log')<br>plt.legend(loc= 'lower right')<br>plt.xlabel('Parmeter')<br>plt.ylabel('Accuracy')<br>plt.ylim([0.6, 1.0])<br>plt.tight_layout()<br><br>plt.show()<br>
seaborn
sns.set()
初始化默认参数
主题风格
sns.set_style("dark")
darkgrid
whitegrid
dark
white
ticks
调色板
color_palette()
能传入任何matplotlib所支持的颜色<br>不写参数则默认颜色
set_palette()
设置所有图的颜色
hls_palette()
亮度和饱和度
lightness
亮度
saturation
饱和度
sns.palplot(sns.hls_palette(8, l=.3, s =.8))
sns.palplot(sns.color_palette("Paired", 10))
连续色板
sns.palplot(sns.color_palette("Blues"))
sns.palplot(sns.color_palette("BuGn_r"))
反转渐变,增加_r
sns.palplot(sns.color_palette("cubehelix", 8))
sns.palplot(sns.cubehelix_palette(8, start = .5, rot = -.75))
cubehelix_palette()
色调线性变换
定制连续调色板
light_palette()
sns.palplot(sns.light_palette("green", reverse = True))
dark_palette()
分类色板
palette = sns.color_palette()<br>sns.palplot(palette)
6种颜色循环主题
deep
muted
pastel
bright<br>
dark
colorblind
圆形画板
pal = sns.palplot(sns.color_palette("hls", 8))
sns.boxplot(data = df, palette = pal )
画图
样式
画图与轴线距离
sns.despine(offset = 30)
保留的坐标轴
sns.despine(left = True)
设置风格
sns.set_context('paper', font_scale=1.5, rc={"lines.linewidth": 2.5})<br>
其他风格
notebook
poster
talk
paper
设置颜色
palette = {"male": "g", "female": "m"}
设置图形
markers = ["^", "o"]
设置线
linestyles = ["-", "--"]
方向
orient = "h"
设置透明度
alpha=0.7
bdistplot
柱状图
sns.bdistplot(data = df, bins=20, kde=False, fit=stats.gamma)
fit 显式分布曲线
jointplot
sns.jointplot(x = "X", y = "y", data = df )
sns.jointplot(x = "X", y = "y", kind = "hex", color = "k", data = df )
sns.pairplot(iris)
绘画单特征分布,及2个特征之间的关系图
箱线图
sns.boxplot(data=tips, x = "total_bill", y = "day", hue = "sex")
小提琴图
sns.violinplot(data=tips, x = "total_bill", y = "day", hue = "sex")
regplot()
sns.regplot(x = "total_bill", y = "tip", data = tips)
sns.lmplot(x = "total_bill", y = "tip", data = tips)
# x_jitter 增加随机浮动<br>sns.regplot(x="size", y = "tip", data = tips, x_jitter=0.5)
stripplot()
sns.stripplot(x = "day", y = "total_bill", data = tips)
# jitter 偏移数据,防止聚堆<br>sns.stripplot(x = "day", y = "total_bill", data = tips, jitter = True)<br>
swarmplot()
sns.swarmplt(x = "day", y = "total_bill", data = tips)<br>
boxplot
sns.boxplot(x = "day", y = "total_bill", hue = "sex", data = tips)
barplot
sns.barplot(x="sex", y = "survived", hue = "class", data = titanic)<br>
pointplot
sns.pointplot(x="sex", y = "survived", hue = "class", data = titanic)
点图,比较差异性
factorplot
sns.factorplot(kind = "bar", x = "day", y = "total_bill", hue = "smoker", data = tips)<br>
参数
FacetGrid
g = sns.FacetGrid(tips, col = "time", hue = "sex", palette="set1", size = 5, hue_kws={"marker": ["^", "o"]})<br>g.map(plt.hist, "total_bill", "tip", s = 100, linewidth=.5, edgecolor = "white")<br>g.set_axis_labels("xxxxx", "yyyy")<br>g.set(xticks=[10, 30, 50], yticks=[2, 6, 10])<br>g.fig.subplots_adjust(wspack=.5, hspack=.5) # 设置图间隔<br>g.add_legend()<br>
添加说明项
add_legend()
size = 4
aspect = .5
长宽比
row_order
row_order = Categorical(["x", "y"])
指定顺序
s
点的大小
s = 50
linewidth
linewidth = .5
线宽
edgecolor
edgecolor = "white"
颜色
set_axis_labels
g.set_axis_labels("x", "y")
显式坐标轴标签
vars
vars = ["sex", "Age"]
指定绘画的数据
组合
sns.violinplot(x = "day", y = "total_bill", data = tips, inner= None)<br>sns.swarmplot(x = "day", y = "total_bill", data = tips, color= "w", alpha = 0.5)<br>
正态分布
import seaborn as sns<br>from scipy.stats import norm<br># 分布 黑色线为正态分布,蓝色为真实分布,房价非正态分布<br>sns.distplot(train['SalePrice'], fit = norm)<br>
热力图
sns.heatmap(corr, vmax = 1, vmin=5, vmax = 10, square = True, center = 0)
center = 0
设置以0为中心
箱线图
plt.figure(figsize = (12, 6))<br>sns.boxplot(x = 'Neighborhood', y = 'SalePrice', data = train)<br>plt.axis(ymin = 0 , ymax = 800000)<br>plt.xticks(rotation=90)<br>plt.show()
# y变量箱线图<br>train.SalePrice.plot(kind = 'box', sym = 'b*')
corr_cols = corr.loc[:, corr.loc['SalePrice', :].abs() > corr_threshvalue].columns<br>number_para[corr_cols].plot(sym='b*', kind = 'box', subplots = True, figsize = (20, 8))<br>
直方图
count_classes.plot(kind = 'bar')
小提琴图
#小提琴图<br>import seaborn as sns<br>plt.figure(figsize = (12, 8))<br>sns.violinplot(data = pd.DataFrame(X_selected_standardized, columns = selected_features), plaette="Set3")<br>plt.title('小提琴图-标准化后数据')<br>plt.ylabel('标准化值')<br>plt.xticks(rotation = 45)<br>plt.tight_layout()<br>plt.show()
scipy
qq图
from scipy import stats<br># 利用Q-Q图判断数据是否偏离正态分布<br>stats.probplot(train['SalePrice'], plot = plt)<br>
谱系聚类图
# 聚类数据<br>from scipy.cluster.hierarchy import linkage, dendrogram # 柱状图<br><br>Z = linkage(data3, method = 'ward', metric = 'euclidean')<br># 画谱系聚类图<br>P = dendrogram(Z, 0)<br>plt.show()
sklearn
标准化压缩
scaler = StandardScaler()<br>X_standardized = scaler.fit_transform(X)
参数优化
from sklearn.model_selection import GridSearchCV<br>svm = SVC()<br>grid_search = GridSearchCV(svm, parameters, scoring = 'accuracy', cv = 5)<br>grid_search.fit(x, y)<br><br>grid_search.best_estimator_<br>grid_search.best_score_<br>grid_search.best_params_<br><br>
算法
XGBoost
import xgboost as xgb<br>watchlist = [(dtest, 'val'), (dtrain, 'train')] <br>params = {<br> 'booster':'gbtree',<br> 'objective':'reg:linear',<br> 'early_stopping_rounds': 50,<br> 'eval_metric':'rmse',<br> 'gamma': 0,<br> 'max_depth': 5,<br> 'subsample': 0.6,<br> 'colsample_bytree': 0.9,<br> 'min_child_weight': 1,<br> 'eta': 0.02,<br> 'seed': 123456,<br> 'nthread': 3,<br> 'silent': 0<br>}<br>model = xgb.train(params, dtrain, num_boost_round=200, evals = watchlist)<br>predict_y = model.predict(dtest, ntree_limit = model.best_ntree_limit)<br>
import xgboost as xgb<br>dtrain = xgb.DMatrix(X_train, label = y_train)<br>dtest = xgb.DMatrix(X_test, label = y_test)<br>params = {<br> 'booster':'gbtree',<br> 'objective':'binary:logistic',<br> 'early_stopping_rounds': 50,<br> 'eval_metric':'auc',<br> 'gamma': 0,<br> 'max_depth': 5,<br> 'subsample': 0.6,<br> 'colsample_bytree': 0.9,<br> 'min_child_weight': 1,<br> 'eta': 0.02,<br> 'seed': 123456,<br> 'nthread': 3,<br> 'silent': 0<br>}<br>watchlist = [(dtest, 'val'), (dtrain, 'train')]<br>model = xgb.train(params, dtrain, num_boost_round=200, evals = watchlist)<br>predict_y = model.predict(dtest, ntree_limit= model.best_ntree_limit)<br>
SVM
from sklearn.svm import SVC<br>svm = SVC()<br>svm.fit(X_train, y_train)<br><br>svm.support_<br>svm.support_vectors_<br>svm.n_support_<br>svm.dual_coef_<br>svm.intercept_<br><br>pred = svm.predict(X_test)<br>print(classification_report(y_test, pred))<br>
K近邻
from sklearn.neighbors import KNeighborsClassifier<br>knn = KNeighborsClassifier()<br>knn.fit(X_train, y_train)<br><br>pred = knn.predict(X_test)<br>print(classification_report(y_test, pred))<br>
parameters = {<br> 'n_neighbors':[3, 5, 10, 15, 20, 30],<br> 'weights': ['uniform', 'distance'],<br> 'p':[1, 2]<br>}<br>knn = KNeighborsClassifier()<br>grid_search = GridSearchCV(knn, parameters, scoring='accuracy', cv = 5)<br>grid_search.fit(x, y)<br><br>grid_search.best_estimator_<br>grid_search.best_score_<br>grid_search.best_params_<br>
Kmeans
kmeans = KMeans(n_clusters = 3)<br>kmeans.fit(features)<br><br>kmeans.cluster_centers_<br>kmeans.labels_<br><br>kmeans.fit_predict(features)<br>cluster_label = kmeans.predict(features)<br>
# 我们计算K值从1到10对应的平均畸变程度<br><br># 利用scipy 求解距离<br>from scipy.spatial.distance import cdist<br>K = range(1, 10)<br>meandistortions = []<br>for k in K:<br> kmeans = KMeans(n_clusters = k)<br> kmeans.fit(features)<br> meandistortions.append(sum(np.min(cdist(features, kmeans.cluster_centers_, 'euclidean'), axis = 1))/features.shape[0])<br><br>plt.plot(K, meandistortions, 'bx--')<br>plt.xlabel('k')<br>plt.ylabel('loss')<br>plt.title('find the best k value')
GBDT
from sklearn.ensemble import GradientBoostingRegressor<br>from sklearn.model_selection import GridSearchCV<br>gbdt = GradientBoostingRegressor()<br>gbdt.fit(X_train, y_train)<br><br>gbdt.score(X_test, y_test)<br><br>print(gbdt.feature_importances_)<br>
parameters = {<br> 'n_estimators':[30, 50, 80, 100],<br> 'learning_rate':[0.1, 0.2, 0.5, 1]<br>}<br><br>gbdt = GradientBoostingRegressor()<br><br>grid_search = GridSearchCV(gbdt, parameters, scoring = 'r2', cv = 5)<br>grid_search.fit(x, y)<br><br>grid_search.best_estimator_<br>grid_search.best_score_<br>grid_search.best_params_
from sklearn.ensemble import GradientBoostingRegressor<br>from sklearn.model_selection import GridSearchCV<br>gbdt = GradientBoostingClassifier()<br>gbdt.fit(X_train, y_train)<br><br>gbdt.score(X_test, y_test)<br><br>print(gbdt.feature_importances_)<br>
parameters = {<br> 'n_estimators':[30, 50, 80, 100],<br> 'learning_rate':[0.1, 0.2, 0.5, 1]<br>}<br><br>gbdt = GradientBoostingClassifier()<br><br>grid_search = GridSearchCV(gbdt, parameters, scoring = 'accuracy', cv = 5)<br>grid_search.fit(x, y)<br><br>grid_search.best_estimator_<br>grid_search.best_score_<br>grid_search.best_params_
AdaBoost
from sklearn.ensemble import AdaBoostRegressor<br>from sklearn.tree import DecisionTreeRegressor<br>from sklearn.model_selection import GridSearchCV<br><br>dtree = DecisionTreeRegressor()<br>adaboost = AdaBoostRegressor(base_estimator = dtree)<br>adaboost.fit(X_train, y_train)<br><br>adaboost.score(X_test, y_test)<br><br>print(adaboost.feature_importances_)<br>
parameters = {<br> 'n_estimators':[30, 50, 80, 100],<br> 'learning_rate': [0.01, 0.1, 0.2]<br>}<br><br>dtree = DecisionTreeRegressor()<br>adaboost = AdaBoostRegressor(base_estimator = dtree)<br><br>grid_search = GridSearchCV(adaboost, parameters, scoring = 'r2', cv = 5)<br>grid_search.fit(x, y)<br><br>grid_search.best_estimator_<br>grid_search.best_score_<br>grid_search.best_params_
from sklearn.ensemble import AdaBoostClassifier<br>from sklearn.tree import DecisionTreeClassifier<br>from sklearn.model_selection import GridSearchCV<br><br>dtree = DecisionTreeClassifier()<br>adaboost = AdaBoostClassifier(base_estimator = dtree)<br>adaboost.fit(X_train, y_train)<br><br>adaboost.score(X_test, y_test)<br><br>print(adaboost.feature_importances_)<br>
parameters = {<br> 'n_estimators':[30, 50, 80, 100],<br> 'learning_rate':[0.1, 0.2, 0.5, 1]<br>}<br><br>dtree = DecisionTreeClassifier()<br>adaboost = AdaBoostClassifier(base_estimator = dtree)<br><br>grid_search = GridSearchCV(adaboost, parameters, scoring = 'accuracy', cv = 5)<br>grid_search.fit(x, y)<br><br>grid_search.best_estimator_<br>grid_search.best_score_<br>grid_search.best_params_
线性回归
一元线性回归
from sklearn import linear_model<br><br>regr = linear_model.LinearRegression()<br>regr.fit(train_x, train_y)<br>print(regr.coef_)<br>print(regr.intercept_)<br><br>y_pred = regr.predict(train_x)<br>plt.scatter(train_x, train_y, color='black')<br>plt.plot(train_x, train_y, color='blue', linewidth=3)<br>plt.show()<br>
多元线性回归
普通线性回归
from sklearn import linear_model<br><br>regr = linear_model.LinearRegression()<br>regr.fit(X_train, y_train)<br>regr.score(X_train, y_train)<br><br>print(regr.coef_)<br>print(regr.intercept_)<br>
Ridge回归(L2正则)
ridgereg = linear_model.Ridge()<br>ridgereg.fit(X_train, y_train)<br>ridgereg.score(X_train, y_train)<br><br>print(regr.coef_)<br>print(regr.intercept_)
Lasso回归(L1正则)
lassoreg = linear_model.Lasso()<br>lassoreg.fit(X_train, y_train)<br>lassoreg.score(X_train, y_train)<br><br>print(lassoreg.coef_)<br>print(lassoreg.intercept_)
预测
pred_y = regr.predict(X_test)<br><br>y_test['pred_y'] = pred_y<br>pred = pd.concat([X_test, y_test], axis = 1)
非线性回归
多项式回归
from sklearn.preprocessing import PolynomialFeatures<br>from sklearn import linear_model<br><br>x = data[['radius_mean']]<br>y = data[['concavity_worst']]<br><br>quadratic_featurizer = PolynomialFeatures(degree = 5, interaction_only=False, include_bias = False)<br>x_quadratic = quadratic_featurizer.fit_transform(x)<br>x_quadratic<br><br><br>regressor_quadratic = linear_model.LinearRegression()<br>regressor_quadratic.fit(x_quadratic, y)<br>regressor_quadratic.score(x_quadratic, y)<br><br>print(regressor_quadratic.coef_)<br>print(regressor_quadratic.intercept_)<br>
预测
y_pred = regressor_quadratic.predict(x_quadratic)<br>plt.scatter(x, y, color='black')<br>plt.plot(x, y_pred, color='blue', linewidth=3)<br><br>plt.show()
随机森林
from sklearn.ensemble import RandomForestRegressor<br>from sklearn.model_selection import GridSearchCV<br><br>rf = RandomForestRegressor()<br>rf.fit(X_train, y_train)<br><br>rf.score(X_test, y_test)<br><br>print(iris.feature_names)<br>print(rf.feature_importances_)<br>
parameters = {<br> 'n_estimators':[5, 10, 15, 20, 30],<br> 'max_features':[1, 2, 3, 4], <br> 'criterion': ['mse', 'mae']<br>}<br><br>rf = RandomForestRegressor()<br>grid_search = GridSearchCV(rf, parameters, scoring = 'r2', cv = 5)<br>grid_search.fit(x, y)<br><br>grid_search.best_estimator_<br>grid_search.best_score_<br>grid_search.best_params_
from sklearn.ensemble import RandomForestClassifier<br>from sklearn.model_selection import GridSearchCV<br><br>rf = RandomForestClassifier()<br>rf.fit(X_train, y_train)<br><br>rf.score(X_test, y_test)<br><br>print(iris.feature_names)<br>print(rf.feature_importances_)<br>
parameters = {<br> 'n_estimators':[5, 10, 15, 20, 30],<br> 'max_features':[1, 2, 3, 4], <br> 'criterion': ['gini', 'entropy']<br>}<br><br>rf = RandomForestClassifier()<br>grid_search = GridSearchCV(rf, parameters, scoring = 'accuracy', cv = 5)<br>grid_search.fit(x, y)<br><br>grid_search.best_estimator_<br>grid_search.best_score_<br>grid_search.best_params_
逻辑回归
from sklearn.linear_model import LogisticRegression<br>from sklearn import metrics<br><br>from sklearn.metrics import confusion_matrix<br>from sklearn.metrics import precision_score<br>from sklearn.metrics import recall_score<br>from sklearn.metrics import f1_score<br>from sklearn.metrics import accuracy_score<br>from sklearn.metrics import classification_report<br><br>lr = LogisticRegression()<br>lr.fit(X_train, y_train)<br><br>y_train_pred = lr.predict(X_train)<br>classification_report(y_train, y_train_pred)<br><br>y_test_pred = lr.predict(X_test)<br>classification_report(y_test, y_test_pred)<br><br>lr.intercept_<br>lr.coef_<br>pd.DataFrame(list(zip(np.transpose(lr.coef_), train_X.columns)), columns = ['coef', 'columns'])<br>
多分类
from sklearn.linear_model import LogisticRegression<br>lr = LogisticRegression(multi_class = 'ovr')<br>lr.fit(x, y)<br><br>pred = lr.predict(x)<br>classification_report(y, pred)<br>matrix = confusion_matrix(y, pred)<br>matrix<br>
决策树
from sklearn import tree<br><br>from sklearn import metrics<br>from sklearn.metrics import confusion_matrix<br>from sklearn.metrics import precision_score<br>from sklearn.metrics import recall_score<br>from sklearn.metrics import f1_score<br>from sklearn.metrics import accuracy_score<br>from sklearn.metrics import classification_report<br><br>dtree = tree.DecisionTreeClassifier(max_depth = 3)<br>dtree.fit(X_train, y_train)<br><br>dtree.classes_<br>dtree.feature_importances_<br>dtree.max_features_<br>dtree.n_classes_<br>dtree.n_features_in_<br>dtree.n_outputs_<br>dtree.tree_<br><br>pred = dtree.predict(X_test)<br>print(classification_report(y_test, pred))<br>
## 2. 在jupyter 中直接显式图片<br>from IPython.display import Image<br>import pydotplus<br><br>dot_data = tree.export_graphviz(dtree, out_file=None,<br> feature_names = iris.feature_names, <br> class_names = iris.target_names,<br> filled = True, rounded = True,<br> special_characters=True)<br>graph = pydotplus.graph_from_dot_data(dot_data)<br>Image(graph.create_png())
parameters = {<br> 'criterion':['gini', 'entropy'],<br> 'max_depth': [1, 2, 3, 4, 5, 6, 7, 8],<br>}<br><br>dtree = tree.DecisionTreeClassifier()<br>grid_search = GridSearchCV(dtree, parameters, scoring= 'accuracy', cv = 5)<br>grid_search.fit(x, y)<br><br>grid_search.best_estimator_<br>grid_search.best_score_<br>grid_search.best_params_<br>
回归树
from sklearn import tree<br>dtree = tree.DecisionTreeRegressor(max_depth=3)<br>dtree.fit(X_train, y_train)<br><br>from sklearn.metrics import explained_variance_score<br>from sklearn.metrics import mean_absolute_error<br>from sklearn.metrics import mean_squared_error<br>from sklearn.metrics import r2_score<br><br>y_pred = dtree.predict(X_test)<br># 解释方差<br>explained_variance_score(y_test, y_pred)<br># 绝对平均误差<br>mean_absolute_error(y_test, y_pred)<br># 均方误差<br>mean_squared_error(y_test, y_pred)<br># 决定系数 R2<br>r2_score(y_test, y_pred)<br>
#查看决策树<br>from IPython.display import Image<br>import pydotplus<br><br>dot_data = tree.export_graphviz(dtree, out_file= None, <br> filled=True, rounded=True, <br> special_characters = True)<br><br>graph = pydotplus.graph_from_dot_data(dot_data)<br>Image(graph.create_png())<br>
朴素贝叶斯
GaussianNB
from sklearn import naive_bayes<br>from sklearn.model_selection import GridSearchCV<br><br>from sklearn import metrics<br>from sklearn.metrics import confusion_matrix<br>from sklearn.metrics import precision_score<br>from sklearn.metrics import recall_score<br>from sklearn.metrics import f1_score<br>from sklearn.metrics import accuracy_score<br>from sklearn.metrics import classification_report<br><br>nb1 = naive_bayes.GaussianNB()<br>nb1.fit(X_train, y_train)<br><br>from sklearn.metrics import classification_report<br>pred = nb1.predict(X_test)<br>print(classification_report(y_test, pred))<br>
MultinomialNB
nb2 = naive_bayes.MultinomialNB()<br>nb2.fit(X, y)<br>print(nb2.predict(X))
BernoulliNB
nb3 = naive_bayes.BernoulliNB()<br>nb3.fit(X, y)<br>print(nb3.predict(X))
anacoda
conda list
conda install numpy
anaconda search -t conda tensorflow
anaconda show jjhelmus/tensorflow


Collect
Get Started
Collect
Get Started

Collect
Get Started

Collect
Get Started
评论
0 条评论
下一页

